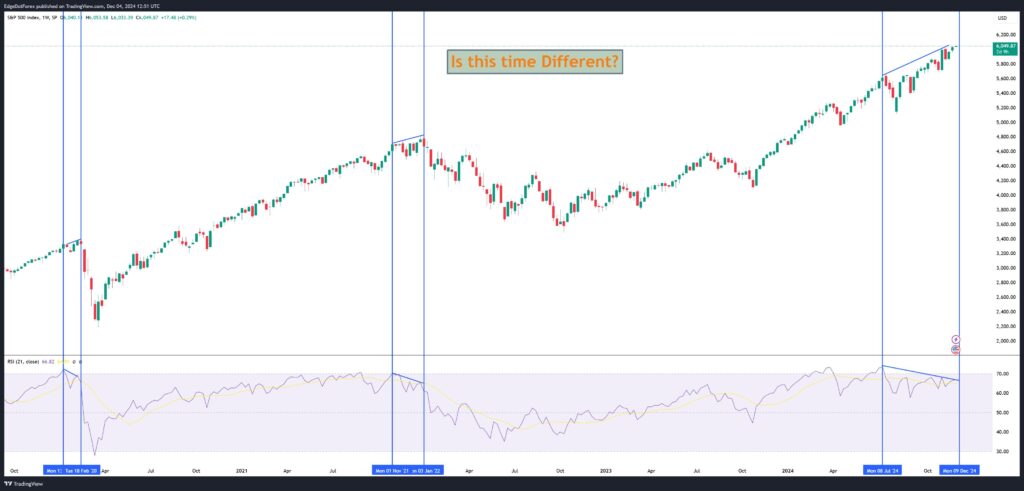
The S&P 500 weekly chart is currently showing a classic technical warning: bearish RSI divergence. While prices are reaching new highs, momentum indicators are telling a different story. This pattern has historically been followed by significant market corrections, and investors should approach with caution.
Understanding S&P 500 Divergence: What It Means
A divergence occurs when the price of an asset moves in the opposite direction of an indicator such as the Relative Strength Index (RSI). In this case, the S&P 500 is making higher highs, but the RSI is forming lower highs. This is known as bearish divergence, a sign that upward momentum is weakening and a potential reversal could be ahead.
Real-Life Examples of S&P 500 Divergence:
- February 2020: A bearish RSI divergence appeared just before the COVID-19 market crash. The index lost over 30% in a few weeks.
- January 2022: Another bearish divergence signaled the beginning of a year-long bear market, with the S&P 500 dropping over 20%.
Now, in December 2024, we are seeing a very similar pattern emerge once again. If history repeats, this may not be a time to chase highs.
Key Technical Levels to Watch in the S&P 500
Rising Trendline Resistance
The S&P 500 is currently testing the upper boundary of a long-term rising trendline, acting as a strong resistance level. This area, around 6,050–6,100, has been difficult for the index to break in the past. A rejection here could trigger a reversal.
Momentum Weakness on RSI
The RSI, currently trending downward while price moves up, shows weakening buying momentum. This divergence suggests that bulls are losing strength, and a correction could be imminent if the trend continues.
Price Targets and Support Zones for Traders
If the S&P 500 divergence plays out as expected, traders should watch the following key support levels:
- Initial support: 5,800 – A breakdown below this could trigger selling pressure.
- Next targets: 5,400 and 5,200 – Levels that acted as support during past consolidations and corrections.
These zones may attract buyers again, but only after a potential pullback completes.
Risk Management During S&P 500 Divergence
Traders and long-term investors should consider risk management strategies during this period of divergence:
- Tighten Stop-Losses: Reduce exposure on high-risk trades, especially near resistance levels.
- Hedge with Inverse ETFs or Options: Consider instruments like SPXU, SQQQ, or put options to hedge against potential downside.
- Reduce Leverage: During periods of divergence, leveraged positions can become highly volatile and risky.
Why This Time May Not Be Different
While some analysts argue that today’s market is more resilient due to strong earnings, AI-driven growth, and better central bank coordination, technical signals remain consistent with past market corrections. The S&P 500 divergence has proven reliable in prior cycles. Ignoring this could mean missing early warning signs.
Investor Sentiment Case Study
In January 2022, investor sentiment remained bullish even as RSI divergence grew. Many continued to buy the dip. By June 2022, the index had dropped over 1,200 points. This demonstrates the importance of respecting technical patterns, even during optimistic macroeconomic conditions.
Fundamental Context Behind the Divergence
Inflation and Central Banks
While inflation has cooled slightly, it remains above target in several major economies. The U.S. Federal Reserve has maintained a cautious stance, holding interest rates higher for longer. This creates pressure on growth and could slow earnings, leading to future corrections.
Earnings Season Expectations
If corporate earnings miss expectations in Q1 or Q2 of 2025, it could serve as a catalyst for the market to break below support levels identified in the S&P 500 divergence pattern.
Final Thoughts: Prepare for Possible S&P 500 Reversal
The current S&P 500 divergence is a signal that should not be ignored. Historical examples suggest that similar patterns have preceded major declines. While this does not guarantee a crash, it calls for disciplined risk management.
Action Steps:
- Monitor RSI and price action around the 6,050–6,100 level.
- Consider partial profit booking if heavily invested in U.S. equities.
- Watch macroeconomic data and earnings reports for signs of slowdown.
Staying cautious during periods of technical divergence has proven to be a wise approach. Whether you’re a trader or long-term investor, paying attention to these signals can help protect your capital and improve decision-making.
And And Join our Discord to survive and thrive in this market chaos!
Click here to read our latest article: USDCHF Bullish Breakout.