
The USDCHF pair has shown strong bullish signals in recent weeks. A clear inverse head-and-shoulders pattern formed between October and November, leading to a significant USDCHF breakout. This is a classic reversal pattern that often signals the end of a downtrend and the start of an upward move. The breakout confirmed the shift in market sentiment, and the pair has since moved into a bullish ascending channel, indicating continued strength from buyers.
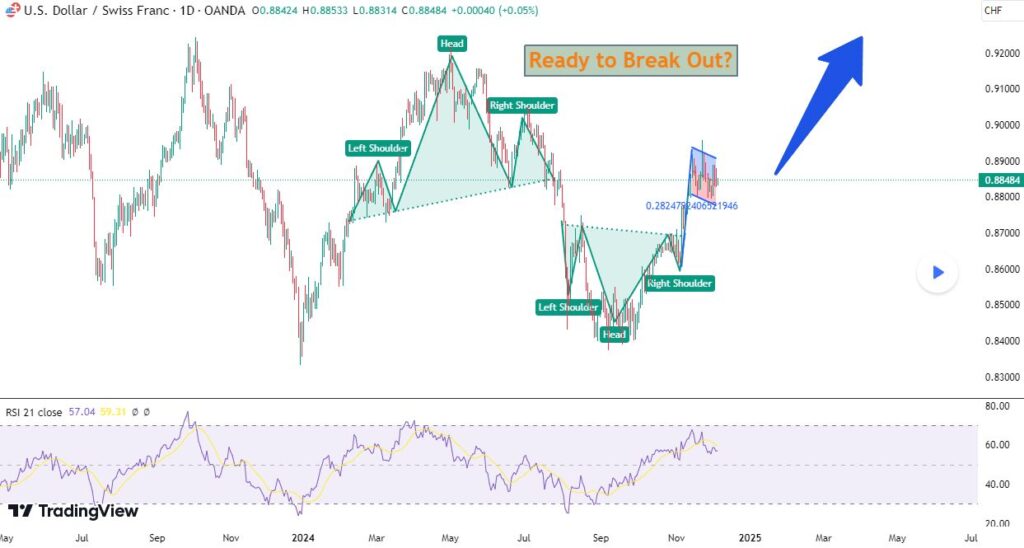
RSI Confirms Strength in the USDCHF Breakout
The Relative Strength Index (RSI) is currently sitting in the 56–60 range. This is an important zone for traders. It shows that:
- Momentum is strong but not yet overbought
- There is still room for further price appreciation
- No signs of bearish divergence have been spotted so far
A healthy RSI supports the ongoing USDCHF breakout scenario, suggesting the trend has strength to continue.
Key Levels to Watch in the USDCHF Breakout
Traders should focus on the following technical levels:
- Resistance at 0.8900: This level has acted as a strong cap on price. A breakout above this zone could trigger a move toward 0.9000 and possibly 0.9100.
- Support at 0.8800: This is the lower boundary of the ascending channel. Holding above this level confirms that buyers remain in control.
A daily close above 0.8900 could act as a breakout confirmation for bullish continuation.
Bullish Scenario: Price Projection for USDCHF
If the pair breaks above 0.8900, we can expect:
- A continuation toward 0.9000, which would attract further buying interest
- Potential extension to 0.9100 with the help of fundamental catalysts like U.S. dollar strength or Swiss franc weakness
Real-World Example: During March 2023, a similar bullish breakout on the USDCHF pair from 0.8750 to 0.9050 occurred following a Fed rate hike and SNB dovish statement. This highlights how technical breakouts often align with macroeconomic triggers.
How to Trade the USDCHF Breakout
Here’s a simple strategy for traders watching this setup:
1. Buy the Dip Near Support
If the price pulls back to 0.8800 (channel bottom) and holds, consider entering long positions with a tight stop just below the support zone.
2. Breakout Entry Above 0.8900
If the price breaks and closes above 0.8900, it confirms a breakout. Entry at this level targets a move toward 0.9000 or even 0.9100.
3. Risk Management
Always manage risk effectively. A break below 0.8800 would invalidate the current bullish setup, and stop-losses should be placed accordingly to minimize downside exposure.
Technical Overview: USDCHF Breakout Remains Valid
- Chart Pattern: Inverse head-and-shoulders followed by an ascending channel
- Momentum Indicator: RSI shows strength, no divergence
- Resistance Zone: 0.8900 (Breakout zone)
- Support Zone: 0.8800 (Channel support)
If global fundamentals remain supportive, including steady U.S. interest rates and stable risk sentiment, the USDCHF breakout could develop into a mid-term bullish trend.
Final Thoughts: What Traders Should Expect Next
The USD/CHF pair is showing strong signs of a bullish continuation. The technical structure supports a potential breakout toward 0.9000+. With RSI favoring buyers and the ascending channel structure intact, this setup offers an attractive opportunity.
Key Takeaways:
- A confirmed breakout above 0.8900 may attract further upside momentum.
- RSI levels indicate strength without overbought conditions.
- As long as the 0.8800 support holds, the bullish outlook remains valid.
Traders should remain patient, wait for confirmation, and manage risk effectively. The USDCHF breakout setup is worth monitoring closely in the days ahead.
Stay sharp, trade smart and join our Discord to follow the momentum!
Click here to read our latest article: Trump Trade Tariffs Threat Looms